On the surface, there’s a singular purpose behind the introduction of stress testing: ensure that the next unprecedented crisis doesn’t cause banks to blow up like they did in 2008/9. Of course, as with so many things in life, the law of unintended consequences means stress tests have morphed from being a single tool with one clear purpose in mind, into a Swiss Army knife-like multi-purpose tool designed to achieve all sorts of objectives.
Indeed, in 2018, the Basel Committee on Banking Supervision, laid out its Stress Testing Principles thus: “As a forward-looking risk management tool, stress testing constitutes a key input into banks’ and authorities’ activities related to risk identification, monitoring and assessment. As such, stress testing should also contribute to formulating and pursuing strategic and policy objectives.”
The COVID-19 pandemic has, if anything, reinforced this BCBS statement. It became clear that multiple, forward-looking scenarios would have been the only way for institutions to prepare for the pandemic before it happened; and that it’s the only way to move forward in a post-crisis world.
Nowadays, savvy financial institutions are seeking to derive benefits from stress tests that go beyond simple compliance. And since the development of such forward-looking scenarios requires significant investment, and in times of crisis scenarios need to be reviewed more frequently, it’s vital we understand how probable these scenarios really are. Only then can organizations select from this multitude of scenarios the ones that are suitable for multiple purposes (financial planning around the 50th percentile; CECL/IFRS 9 – typically 25th/50th/75th percentiles; and for stress testing – usually between the 95th and 99th percentiles).
Knowing probabilities is also important for reverse scenario analysis and stress testing. When scenarios are generated automatically and consistently across all identified risk factors, you get an empirical distribution of outcomes with easily identifiable percentiles. For example, they can show the probabilities of CCAR’s baseline, and severely adverse, scenarios.
The charts below depict one of the variables: BB-rated credit spreads in the financial industry, and a sample capital ratio – one of the critical key performance indicators (KPIs) calculated using a few dozen variables, all of which were expended from the given values of CCAR variables.
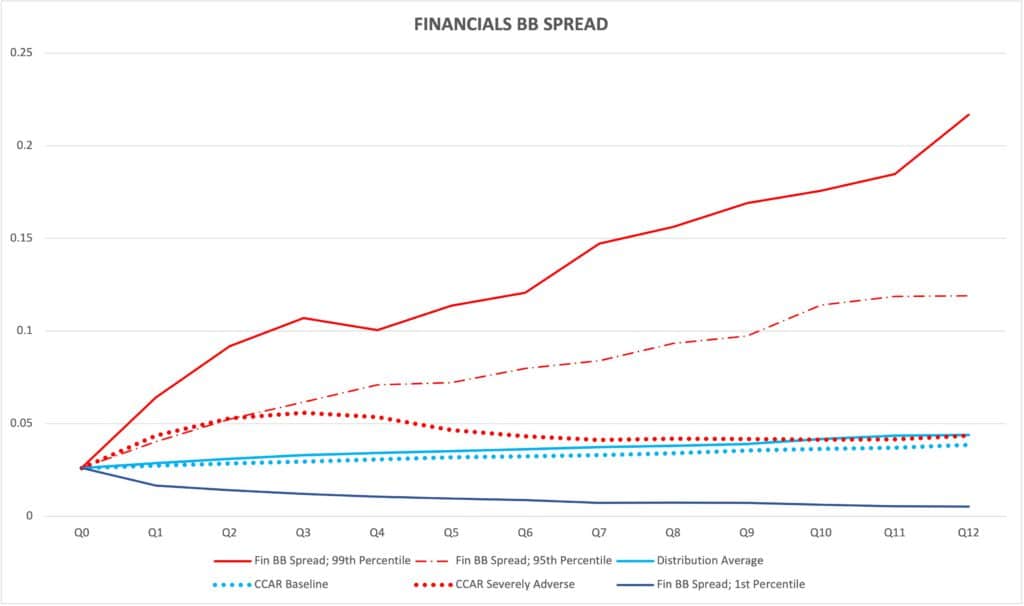
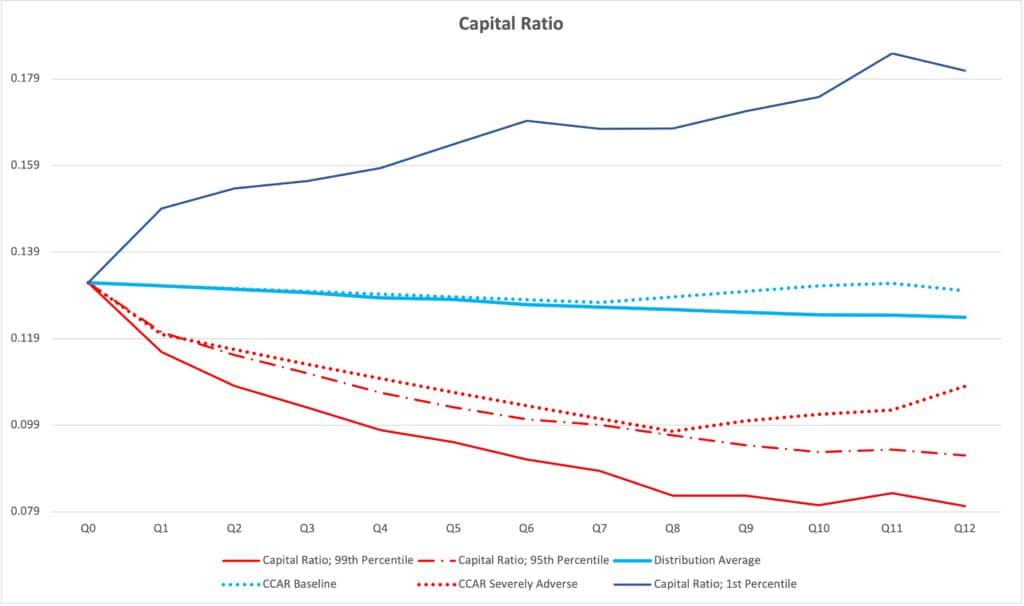
In both cases, the probability of the baseline scenario is within the 49-60% range. The adverse scenario is close to the 95th percentile (i.e. BB-rated credit spread would exceed it only 5 times out of a 100) for the first year (four quarters) of the scenario horizon. Then it recovers and approaches the average line. For the capital ratio, the severely adverse scenario remains around the 95th worst-case percentile for almost eight quarters, before starting to recover.
This happens due to the non-linear dependency of capital ratios and their underlying drivers. Even when the economy starts recovering, as happens in the severe CCAR-2021 scenario, credit losses might keep growing, thus slowing the recovery of banks’ capital ratios.
So the probability of a scenario must be considered with respect to a bank’s particular balance sheet, business model and growth objectives – and not be based on common market drivers.