
The Federal Reserve is emphasizing a more transparent approach to its supervisory stress testing, via its 2025 Comprehensive Capital Analysis and Review (CCAR). However, despite the Fed’s aim for increased transparency, banks may still face discrepancies between their internal stress test results and those produced by the Fed.

To bridge this gap, financial institutions can and should use a benchmark model — one that generates objective, data-driven results without the influence of modeler bias. This will ensure a clearer understanding of how different assumptions and methodologies impact capital requirements.
The Fed’s severely adverse scenario is not necessarily designed to be realistic. Instead, its primary purpose is to stress the financial system as a whole, identifying vulnerabilities under extreme but plausible conditions. Consequently, firms cannot rely solely on the Fed’s scenario; rather, they must conduct additional stress tests that reflect a broader set of risks — both realistic scenarios tailored to their specific business models and others that capture unexpected combinations of risk factors.
An Advanced, Systematic, Multi-Scenario Approach
Customized, firm-specific scenarios can be created manually, but only with limitations. Indeed, manually-designed scenarios tend to reflect known risks and historical patterns, potentially missing unprecedented combinations of movements in key risk drivers.
To address this, firms need to explore a full range of scenarios, using advanced modeling techniques that uncover hidden vulnerabilities. A systematic approach to scenario generation can guide modelers in identifying the most relevant risks, ensuring their stress-testing frameworks remain robust and forward-looking.
To gain a sense of how a benchmarking model can enhance traditional stress testing, let’s consider how it could be applied to this year’s CCAR scenarios. Unlike last year, the Federal Reserve’s 2025 exploratory and severely adverse scenarios are identical. There is no consideration of the continued inflationary environment. However, inflation remains a significant risk, and such scenarios can have a profound impact on consumer loan charge-offs.
Figure 1 illustrates the benchmark scenarios for these charge-offs across residential mortgages, credit cards, and small and medium-sized enterprise (SME) lending.
Figure 1: Reverse Scenario Analysis for 99th-Worst-Case Outcome of Consumer Loan Charge-Offs
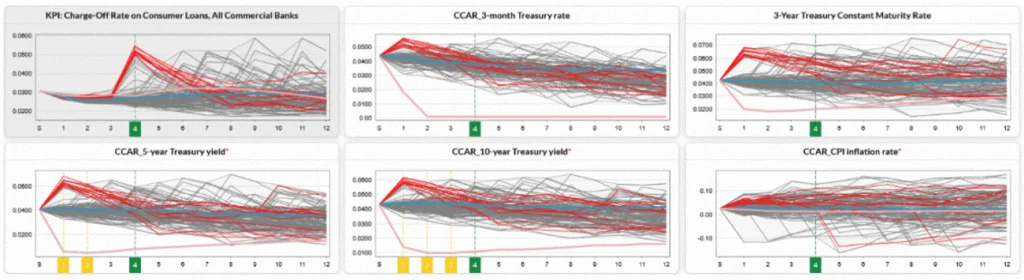
In the example above, we select consumer loans’ charge-offs as the key performance indicator (KPI), and then review the main risk drivers on the same scenarios over the 12-quarter CCAR horizon. The gray lines in Figure 1 represent a broad range of scenarios, while the red lines highlight the 99th-percentile worst-case outcome for combined consumer loan losses. Additionally, the blue and pink lines correspond to the Federal Reserve’s CCAR-2025 baseline and severely adverse scenarios, respectively.
As shown in this reverse scenario analysis, the yield curve spanning short-, medium- and long-term tenors experiences an inflation shock in Q1. Although interest rates revert to their mean relatively quickly, this initial shock triggers a substantial rise in consumer loan charge-offs in quarters two through four of the first year.
Interestingly, these variables (inflation and interest rates) do not significantly influence this KPI in a stable market. When we use a regression with regularization analysis – which evaluates hundreds of potential drivers for each KPI and reduces dimensionality based on cross-validation performance – BBB-rated corporate yields and real estate prices are identified as the primary risk factors.
There is, however, a strong correlation between consumer loan charge-offs and interest rates in the 99th-worst case loan losses. In that environment, reverse stress tests highlight inflation as a critical risk – one that banks heavily exposed to consumer lending must consider.
Notably, the consumer loan charge-offs KPI shows limited sensitivity to the Fed’s severely adverse scenario, with losses increasing by only 10 basis points compared to the baseline scenario. However, in extreme cases, 99th-percentile losses can nearly double, rising from 2.7% to over 5%.
Figure 2 focuses on one specific stress scenario (one of the red lines from Figure 1) where the yield curve exhibits a hump around the three-year tenor. After the Q1 inflation shock, the three-month Treasury rate falls below the three-year rate, while the latter one remains higher than the five- and 10-year rates, creating an unusual yield curve shape.
Figure 2: 99th-Percentile Worst-Case Scenario for Consumer Loans
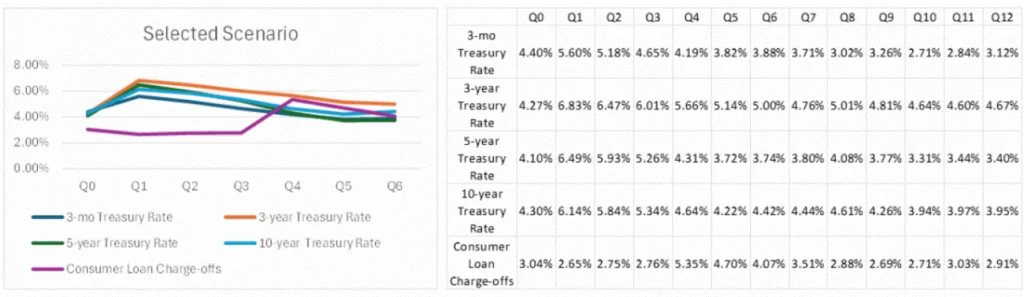
Full scenario analysis for consumer loan charge-offs might have hundreds of variables – but risk managers can use cluster analysis to identify the most impactful risk drivers, as well as GenAI tools to produce a narrative.
Here is a brief summary of a GenAI-driven narrative for the scenario depicted in Figure 2:
The current economic landscape is marked by soaring inflation, as evidenced by a sharp rise in the Consumer Price Index (CPI). With housing costs surging and credit spreads widening, increased borrower risk could lead to a credit crunch, signaling growing economic distress. The combination of rising inflation, a downturn in the mortgage-backed securities market, and heightened financial volatility underscores a period of economic instability, particularly impacting housing and essential consumer goods.
It is doubtful that a conventional scenario-generation process would highlight such a non-linear behavior of the yield curve.
Parting Thoughts
Specific scenarios for banks concentrated in consumer lending have been identified and dissected in the advanced, multi-scenario modeling approach we’ve described in this article. These scenarios may vary depending on the type of financial institution.
There is one truth, though, that cuts across all firms: risk drivers of major losses are different in stable and stressful situations due to drastically changing correlations in stress scenarios. This means that even large institutions that can afford diversification across products, geographies and business lines should perform exhaustive reverse stress testing to discover scenarios specific to the profile of their exposures.
Modern technology enables everybody to perform such an analysis quickly and effectively. Doing it as a benchmark exercise eliminates the potential bias that plagues management overlays in manual scenario design process. Moreover, it improves communication with the regulators, which helps prevent matters requiring attention (MRA) and matters requiring immediate attention (MRIA).
Performing such benchmarking analysis before submitting CCAR results can accelerate and inform the internal modeling process. In short, it turns stress testing from a regulatory checkbox exercise into constructive strategic planning.
Source: GARP “How to Make Stress Tests More Constructive and Informative”