
We’ve seen extreme turbulence in the markets over the last week. The Interbank Rate in Japan averaged 0.10 percent from 2014 until 2024, reaching an all-time high of 0.45 percent in August of 2024.
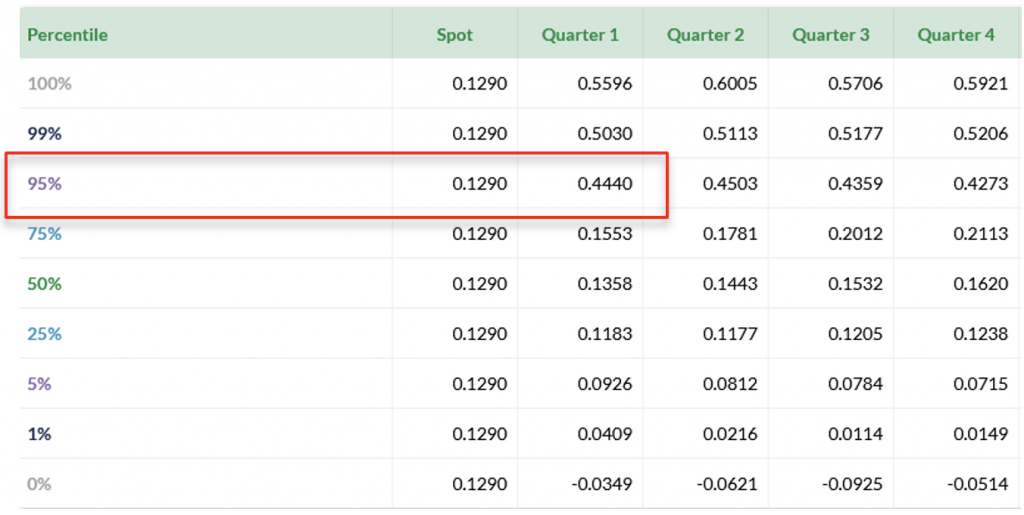
At Straterix we ran an out-of-sample back-testing of the rates in Japan. The probability of this shock within the third quarter of 2024 based on the data prior to the second quarter was around 5%. See the full distribution below:
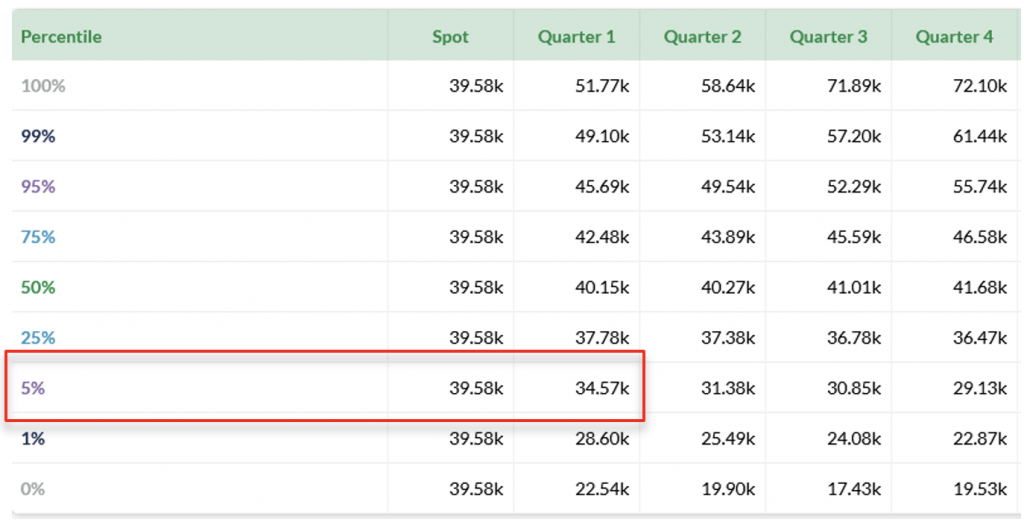
We also took a look at the Nikkei that dropped by 13% following a Japan rate hike announcement – and saw that the event had had more than 5% probability of occurring. Below is Nikkei’s values probability distribution from the end of Q2 2024:
The next big questions now are whether Japanese interest rates will a) keep moving up, b) come down, or c) stay where they are now. Here are a few examples of scenarios that Straterix can design and explore in a matter of minutes and their impact on the US market drivers and respectively on your institution:
(A) Japanese rates keep moving up
(B) Japanese rates come down
(C) Japanese rates stay where they are now…
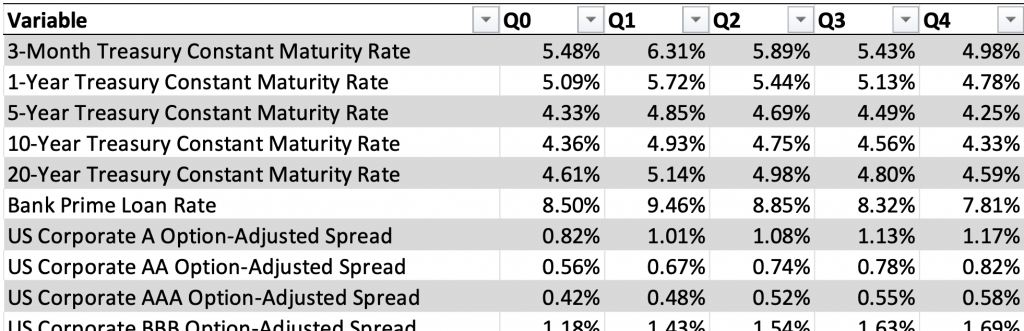
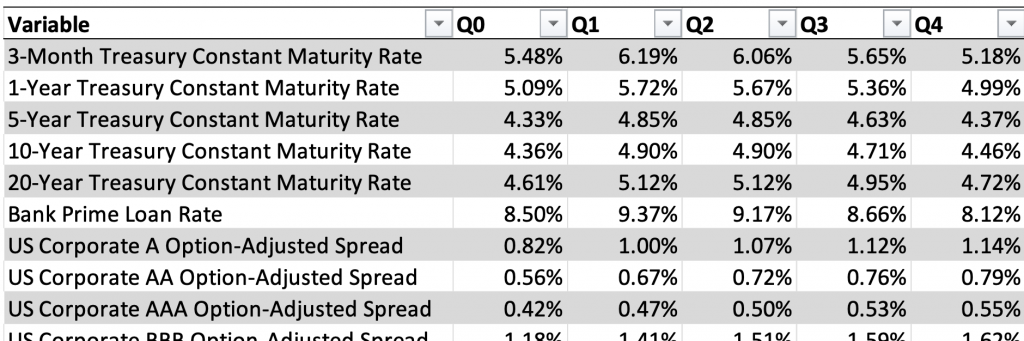
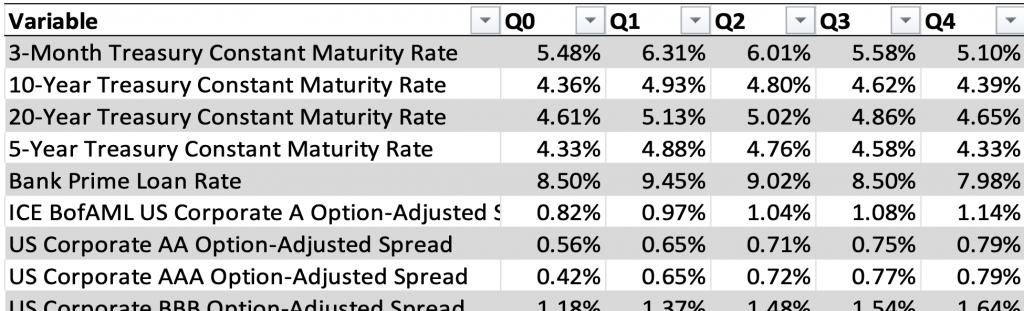
Using Straterix’s instantaneous scenario expansion functionality one can immediately obtain full-fledged scenarios with all required (other) variables quantified.
Looking wider in the region, Japan is not the only volatile geography at the moment. In addition to the above analyzed market fluctuation, what are the long-term implications and widespread impact from potential political and economic instability in China?
Here is a specific example of political risk analysis through tail risk correlations and EWIs (Early Warning Indicators):
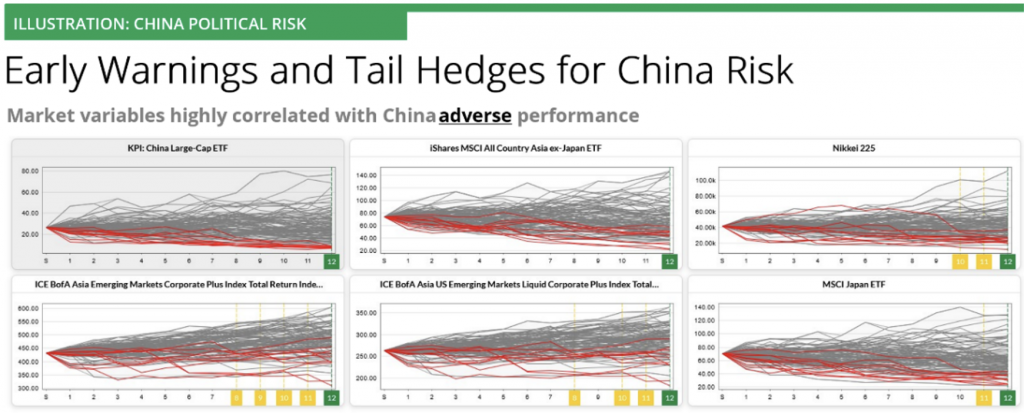
- Market & political risk exposure to China can be effectively hedged with Japanese and Asia ex-Japan indices
- The worst-case China market performance in quarter 12 is correlated with all the above indices as indicated by the green square markers (the horizontal axis shows quarters)
- A few variables – mainly Asia Emerging Markets – also exhibit early warnings highlighted with yellow square markers as they are correlated with the adverse China performance in Q12 three to four quarters prior
Lastly, in addition to looking at market turbulence, what about the impact of shocks such as the natural disaster that coincided? The recent earthquake in Japan is a totally uncorrelated event that accidentally happened during the same week as the dramatic market events, heightening the fear of longer-term impact on markets from potentially catastrophic consequences like a ‘megaquake’ and/or tsunami.
Straterix allows financial institutions to design and check any kind of ‘what-if’ scenarios and their impact in only minutes.
Don’t hesitate to reach out to us if you want to learn more!
GARP: The Stress Testing Road Ahead: How to Prevent Future Bank Failures